THE HISTORY BA SINCE THE GREAT RECESSION
The 2018 AHA Majors Report Benjamin M. Schmidt
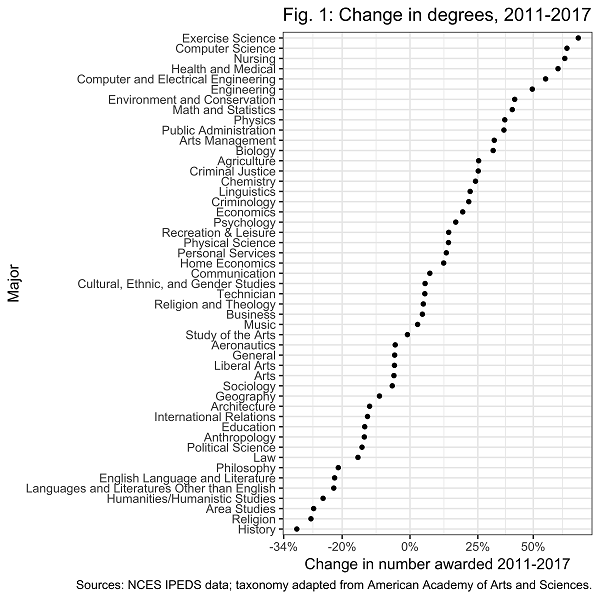
Since the economic crisis of 2008, the pattern of undergraduate majors has been shifting across American higher education. Of all the major disciplines, history has seen the steepest declines in the number of bachelor’s degrees awarded. In 2008, the National Center for Education Statistics reported 34,642 majors in history; in 2017, the most recent year for which data are available, the number was 24,266. Between 2016 and 2017, the number of history majors fell by over 1,500. Even as university enrollments have grown, history has seen its raw numbers erode heavily. The drops have been especially heavy since 2011–12, the first years for which students who saw the financial crisis in action could easily change their majors; of all the fields I’ve looked at (Fig. 1), history has fallen more than any other in the last six years.

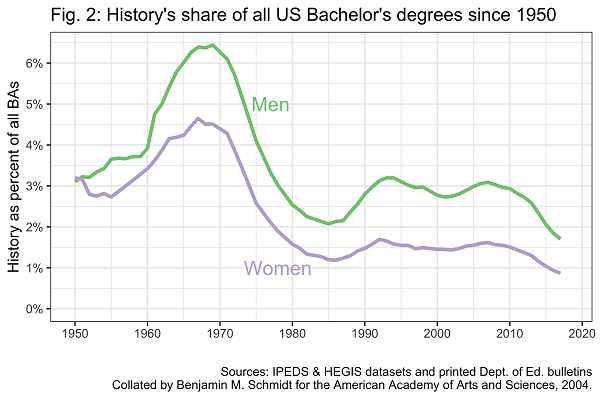
This represents a long-term low for the history major. National data on the numbers of degrees awarded in different disciplines generally start around 1966, but years ago, while working for the American Academy of Arts and Sciences’Humanities Indicatorsproject, I collected data on a number of humanities majors going back to the 1950s. While the 66 percent drop in history’s share from 1969 to 1985 remains the most bruising period in the discipline’s history, that drop followed a period of rapid expansion in share connected to the boom in higher education of the 1960s. The drop in the last decade has put us below the discipline’s previous low point in the 1980s (Fig. 2).
Share can be a misleading metric. Higher education as a whole has drawn in new groups of students in the past half century, so historians sometimes assume that we must not be losing after taking these statistics into account. But even considering history degrees as a percentage ofallcollege-age adults in the United States, the current level of 5.3 degrees per 1,000 23-year-olds sits well below the peaks in 1971 (11.8 per 1,000) and 1993 (7.6 per 1,000), though above the mid-80s trough. Since older students and international students have become more common, this probably underestimates our slide within the core college-going population. Setting ratios aside altogether, the raw number of BAs in history awarded in 2017 was smaller than in any year since 1991, and lower than each year between 1965 and 1977.

DEMOGRAPHIC TRENDS
The decline in history has struck all demographic groups, but some patterns do emerge (Fig. 3). The most pronounced losses have been among Asian American students, who were already underrepresented in history departments relative to their share of all students. The drop among white students, who make up 71 percent of history degrees and 58 percent of all BAs, is a bit lower. Hispanic students, who are represented among history majors at the same rate they attend college, mirror the overall trend. African American and American Indian/Alaska Native students—two other groups that are underrepresented in history relative to other majors—have seen the smallest declines.
The drop in history’s share of undergraduate majors in the last decade has put us below the discipline’s previous low point in the 1980s.
Part of the long-term pattern for history has come from the relatively steep decline in women’s interest. As Heidi Tworek explored in a2013Atlanticarticle, this trend emerged in the 1970s: pre-professional majors became more welcoming of women, so they were less inclined to major in liberal arts disciplines. Except among white and multi-racial students, the rate of decline has been notably greater among women than among men; Asian American women were less than half as likely to major in history in 2017 as in 2011. One result of this shift seems to be that women are now slightly more underrepresented among history majors (40.5 percent vs. 42.5 percent of all degrees, as opposed to about 57 percent of BAs in all fields) than they were in the mid-2000s. (A note on categories: unlike some other statistical series, the Department of Education considers gender to be strictly binary and “Hispanic” to be a race akin to “Asian” or “White”; it removes race from foreign alien status for reporting purposes.)

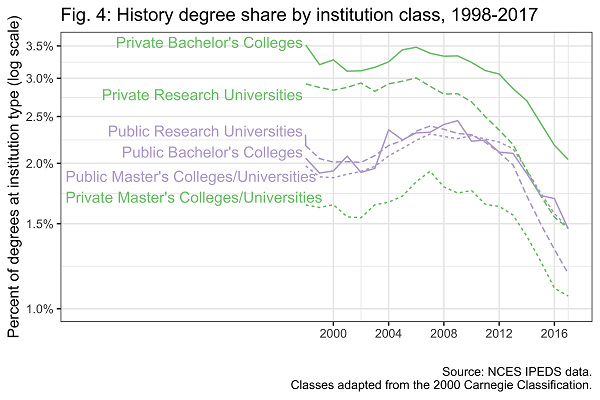
While these declines have taken place at institutions of every type, the declines have been particularly strong in percentages at schools where history has been a popular major (Fig. 4). In the broadest terms, as the chart below shows, history has decreased the most at research universities (RI and RII in the old Carnegie classification). Both private and public universities have seen drops, but the declines have been especially steep at private, non-for-profit institutions. (For-profits remain unimportant enough in the history universe that I haven’t included them.)
This means that each department is facing its own constellation of factors that may make the decline more or less severe. To try to disentangle the role of various factors, I ran a linear regression to predict the decline in history degrees between two five-year periods: 2003–07 and 2013–17. Among the factors that best predict heavier declines are a school being a research university, having a large number of Asian American or foreign students, and being privately controlled/having high tuition. Lighter declines, conversely, are associated with having more African American, multi-racial, or Hispanic students; being a historically black college or university, even accounting for the higher share of African American students at those schools; and (as a control) having an overall growth in the student body. Schools in the Midwest seem to have experienced the greatest declines, accounting for demographics; those in New England and throughout the South, the least.
Why has the number of degrees fallen so rapidly? The timing of the trend strongly suggests that students have changed their expectations of college majors in the aftermath of the economic shifts of 2008. That the declines have continued among students who entered college well into the economic recovery shows that the shifts are not just a temporary response to a missing job market; instead, there seems to have been a longer-term rethinking of what majors can do for students. The fields that have fallen almost as much as history since 2008 tend to share methodologies or subject areas with our discipline; they include most of the other humanities and many of the more qualitatively inclined social sciences, including political science, anthropology, and sociology.
The most pronounced losses have been among Asian Americans, who were already underrepresented in history departments.
In many cases, this anxiety over career prospects for history majors is probably misguided, since we know that students with history BAsdisperse into a wide variety of careers. The increasingly common practice of lumping a wide variety of disparate fields together as STEM is probably giving students and their parents excessive expectations about the earning potential conferred by many science and technology degrees. While engineers in their 20s can indeed make salaries that would make most full professors of history jealous, science, technology, and math majors are much more of a mixed bag. Extensive datarecently released out of the University of Texas systemdo show history majors making less than most science fields after controlling for the university they attended. But they appear to make more than many other fields, including English, psychology, sociology, and even a number of biology-adjacent majors (such as zoology, ecology, and neurobiology, though traditional biology majors make somewhat more). Over the next few years, “accountability” measures like this, largely put into motion shortly after the recession, will become more widespread. While humanists are often skeptical of measuring a major through debt, salaries, or employment after graduation, other fields that havenotalready seen extensive declines probably have more to fear from an honest accounting of salaries than we do.

I focus on economic factors because the timing of the decline in history numbers so strongly correlates with student decision making around the economic crisis, but students obviously think about more than potential earnings when they choose a major. It’s understandable that many, both inside and outside the profession, want to explore more complex reasons for the declines or to use it as an occasion to argue for some particular vision of what undergraduate history study should be. But it is worth reemphasizing that history’s share of majors was rising just a decade ago; an explanation for trends since then should focus on things that have actually changed.
FUTURE TRENDS
Optimists may look at the last year’s line in these charts and note that the rate of decline appears to have slowed. It is reasonable to hope that the trends of the last decade will eventually bottom out, perhaps even in the next year or two. At this point, though, it would take several unprecedented years of growth in history majors to return to mid-2000s numbers; departments should not expect a rapid rebound. While there are anecdotal accounts of students seeking out history in the current political climate, leading indicators of student interest are at best mixed; most notably, the AHA’ssurvey of course enrollments in a number of departmentsfor the 2016–17 academic year found continued declines in credit hours. (Editor’s note: results of the AHA enrollments survey for 2017–18 will be published in the January issue ofPerspectives.)
The shifts are not just a temporary response to a missing job market; there seems to have been a longer-term rethinking of what majors can do for students.
Those enrollment numbers suggest one possible long-term trend: that history departments will become more oriented toward introductory-level courses. Although I am not aware of good data on credit hours for the critical period 2010–12, it seems that the declines in enrollments since then may have been gentler than the drops in majors. Students still take history courses—but more often, apparently, as electives, as requirements for other majors, or as general education requirements. If major numbers do not recover, each of these areas will become more important. One common plan, for joint or hybrid majors, is peripherally tracked in the IPEDS data through reporting of second majors. These numbers capture students who major in fields like “Political science and history” where any other field might occupy the first position. They do not seem to offer great consolation; history’s share of second majors mirrors its overall trend in the last decade.
Ultimately, whether through majors or course enrollments, the long-term state of the discipline will rest on how it adapts to a cohort of students—and their parents—who are much less receptive to arguments for the liberal arts than previous generations have been. Many departments and organizations have worked out useful ways to articulate the purpose of the major. These are undoubtedly helping attract and retain students today. (The institutions that made up AHA’sTuning project, an initiative to this end, are among those on the front lines; the first set of Tuning departments reported marginally better enrollments from 2014 to 2017, though not so strongly that I am confident in their statistical significance.) As the 2008 crisis moves farther into the past, we should attempt to identify departments that have had the most notable successes.
Update, November 30, 2018: The x-axis of Fig. 3 originally indicated that the graph used absolute numbers, not ratios. The text has been updated to reflect this change.
Benjamin M. Schmidt is assistant professor of history at Northeastern University and core faculty at the NuLab for Texts, Maps, and Networks.
As Frank Burns said, “If I made any mistakes in this article, they are God’s will or someone else’s fault.”
Kevin J Palmer
Kevin Palmer
Kevin Palmer Scottsdale
Kevin Palmer Arizona
Economic Justice
Economic Oppression
Peace through Prosperity
Financial Freedom Activist
Financial Literacy
Economic Dignity
Resist
Question authority
Investing
Stock market
Buy Stocks
Contravention
Securities Sales Supervisor
Arizona Based
Merrill Lynch
Liberty St. 10005
Options Trading
Scottsdale
Securities industry
Financial advisor
Financial Industry
Morally and practically
Interference from government
Large corporations
Oppressive institutions
Economic liberty
U.S. Constitution
Stands up for freedom
Greedy malevolent corporations.
Ordinary People
Pawns for Politicians
Bureaucrats
Corruption
Injustices
Ridiculous Restraints
Limit personal freedom
Stifle entrepreneurship
Special interest groups
American Dream
Under Attack
Unreasonable Requirements
Honest Competition
Consumer rights
Managing Director
Strategic Management Advisors
Public advocacy
Strategic research
Emotional Intelligence
Economic Information
Emotional Factors
Sound Financial Decisions.
Forecasting
Investment Policies
Economic Dignity
Improve quality of life
Economic fairness
Cognitive Influences
Attain wealth
Live Authentically
Connecting Personality
Achieve abundance
Without Maliciousness
First Allied Securities
Customer complaints
Terminated
Discretionary Trades
Avoid financial scams
Security fraud
Not affiliated
Losses Recovered
Cutting-edge investigations,
Discretionary Trades
Disciplinary action
Regulatory sanction
Former employer
Broker -Dealer
Regulatory Authority
Exercised discretion
Discharged Quiet Rich
Wealth
Entrepreneurship
Writer Activist
Producer Poet Rebel
Equalize Unfairness
Financial Literacy
Economic prosperity
Honest Enterprise
https://thequietrich.com/author/kevin-j-palmer/
https://thequietrich.com/category/american-dream/
https://thequietrich.com/category/media/
https://thequietrich.com/tag/kevin-j-palmer/
https://thequietrich.com/tag/rebel-magazine/
https://thequietrich.com/tag/rebelmagazine-com/
https://www.facebook.com/thequietrich/
http://www.douglas-budget.com/obituaries/article_2afa6758-4092-11e7-873c-b367d0fe4b6a.html

